This page looks at e621's artwork comment IDs over time, and how those compare to the submission IDs over time.
In general, there are more comments than submissions. At the end of July 2025, there were about 9.22 million comments, and almost 5.75 million submissions, for an all-time average of about 1.6 comments per submission.
Important: These graphs don't automatically update every day. They were generated one time, on 2025-08-01, with the data collected up to that time.
First, a graph of the artwork comment IDs from 2007 to 2025-07-31.
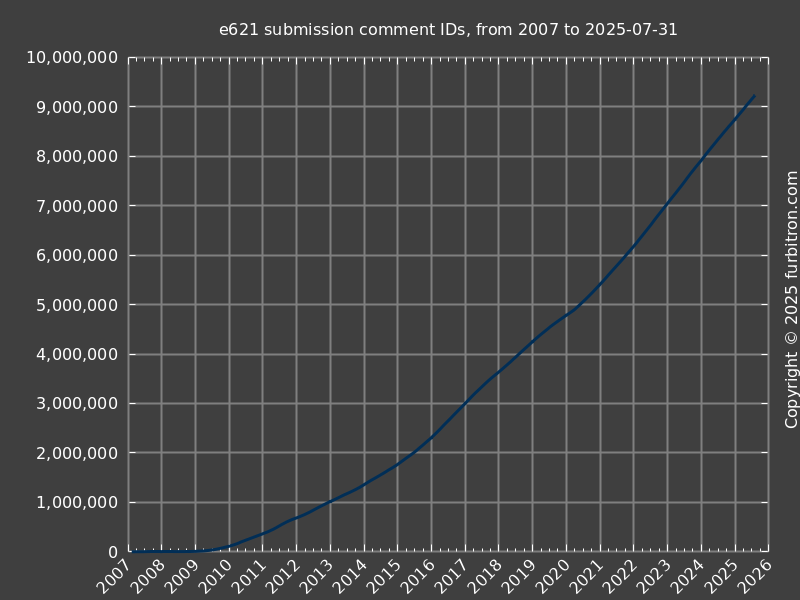
If you hold something with a straight edge (like a piece of paper) up to the screen, you can see that there are four "eras". From 2007 to early 2009, there were hardly any comments at all. From early 2009 to early 2015, the comments picked up, but kept a steady pace. From early 2015 to 2020, they picked up some more, but also kept a steady pace, higher than 2009-2015. From 2020 to now, they picked up again, but also held a steady pace, higher than 2015-202.
Next, the same data in a year-on-year format, similar to Furbitron's year-on-year graphs for the submission IDs.
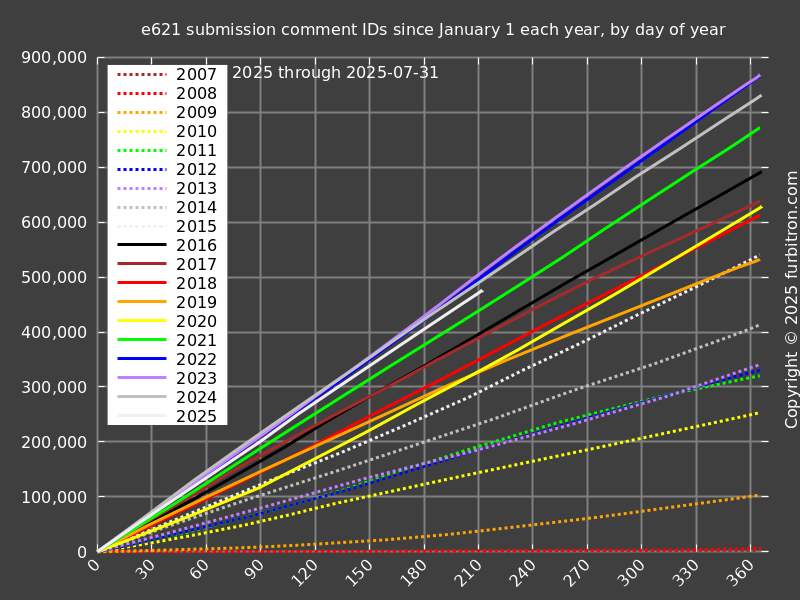
The group of lines at the top right of this graph shows that the years of highest commenting on e621 were 2022 (solid blue) and 2023 (solid purple). These years had about 867,000 comment IDs per year, plus or minus.
Next, the same data in a year-on-year format, but as a bar graph instead of a line graph.
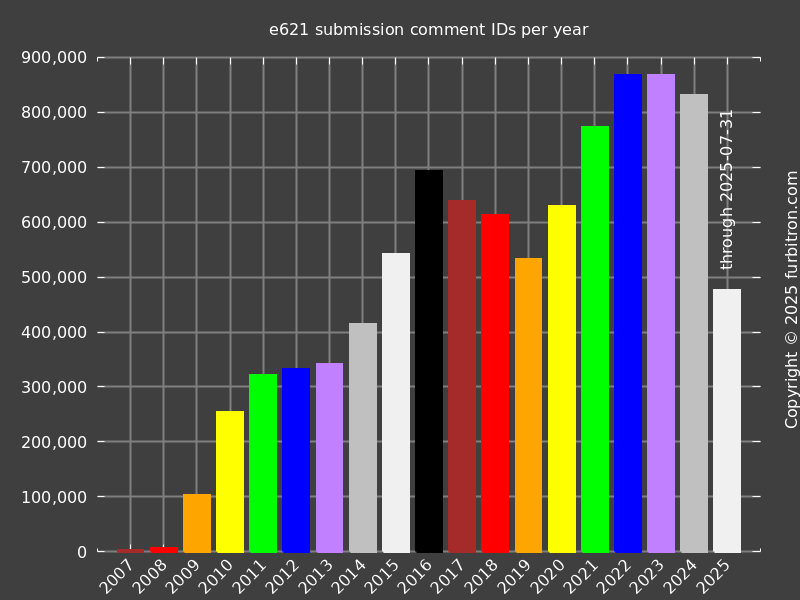
Again, you can see that the years of highest commenting were 2022 and 2023, with about 867,000 comment IDs per year, plus or minus.
Furbitron's regular data collection on submission IDs shows that e621's submission rate has changed over time. In 2008, e621's first full year of operation, there were about 10,700 submissions. In 2024, e621's best full year so far, there were about 770,000 submissions.
By dividing the comment IDs by the submission IDs, the average number of comments per submission can be calculated. The next graph shows this average by year.
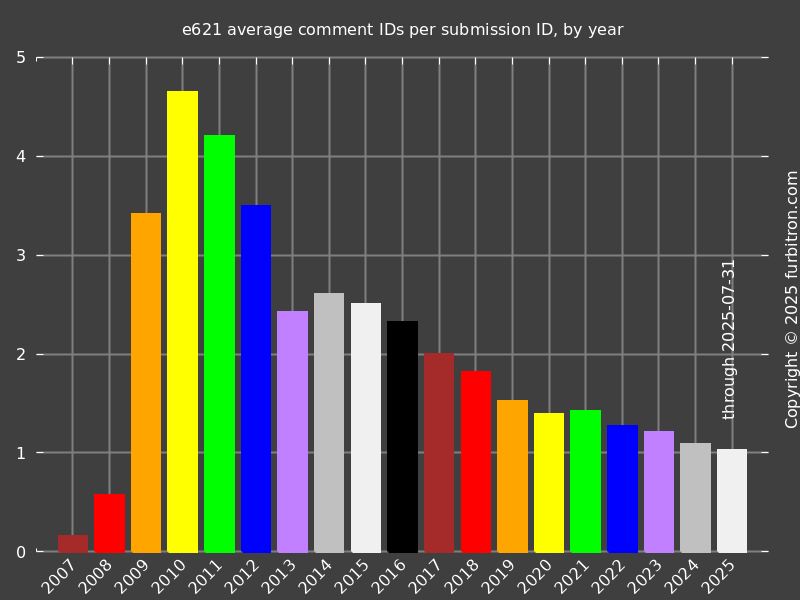
From this, the peak full year was 2010, with 4.7 comments per post, on average. The average dropped every year from then until 2024, when it stood at 1.1 comments per post. 2025 is a slight decline from 2024, so far.