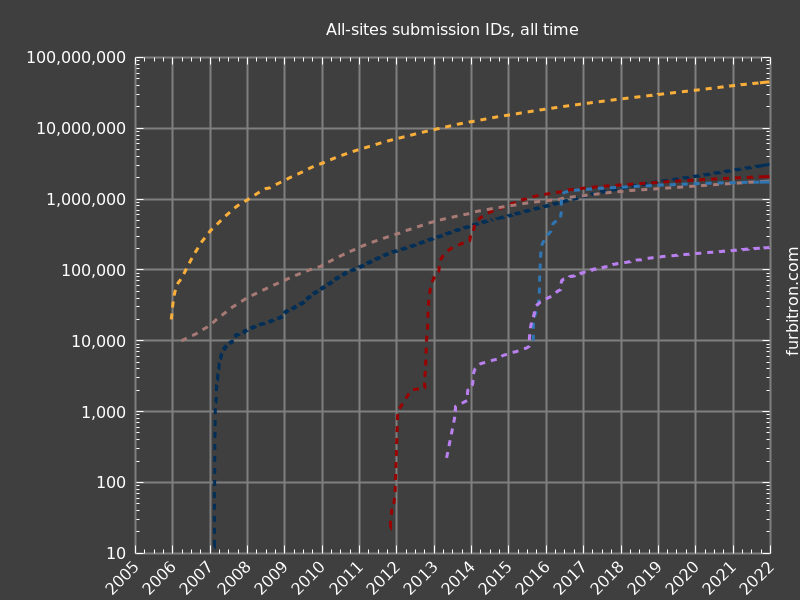
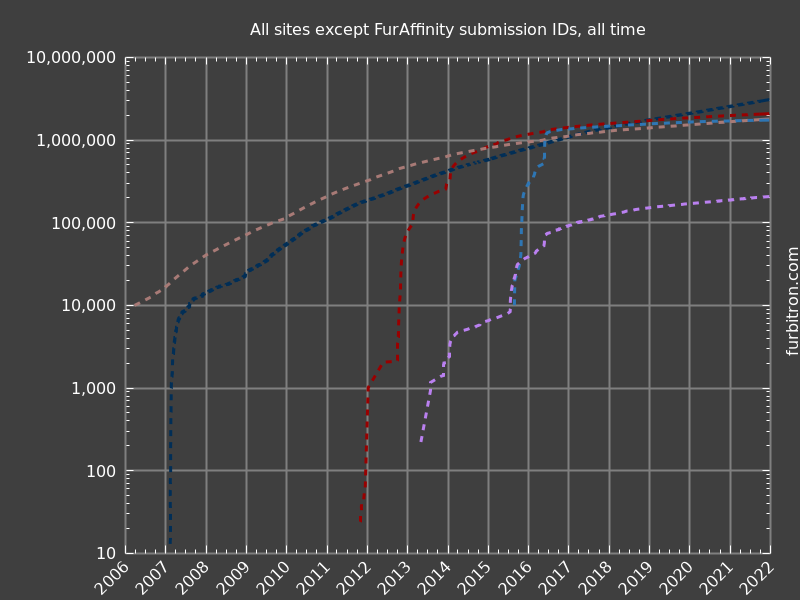
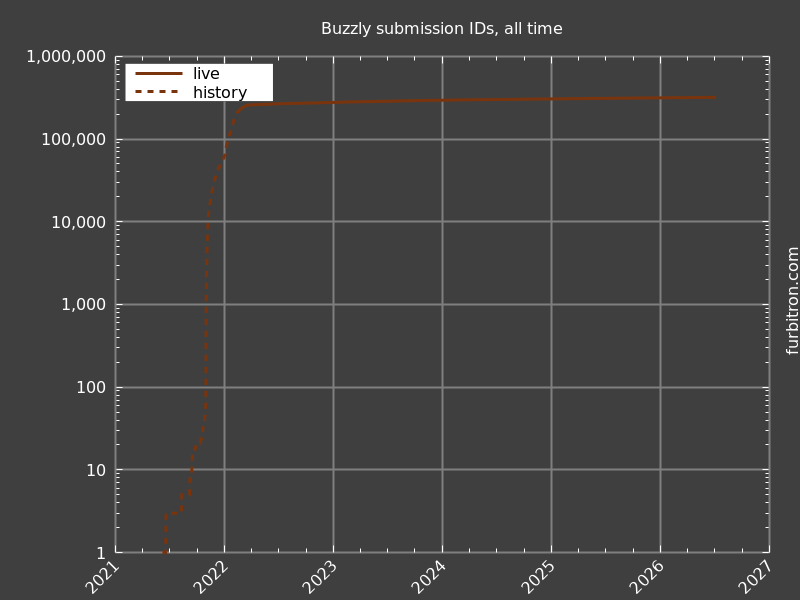
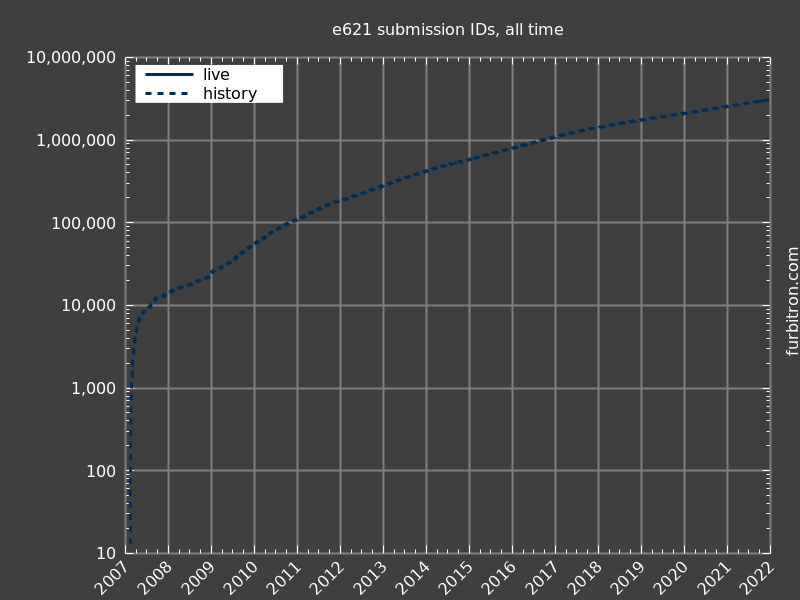
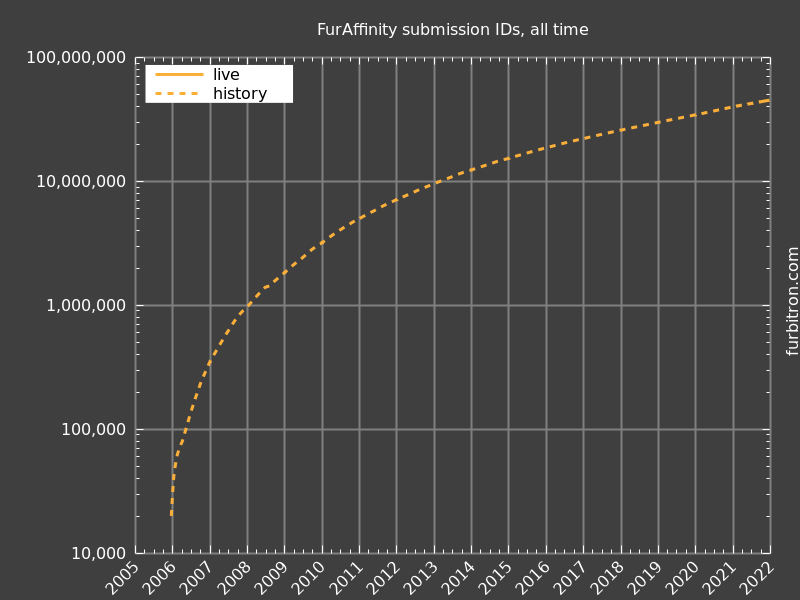
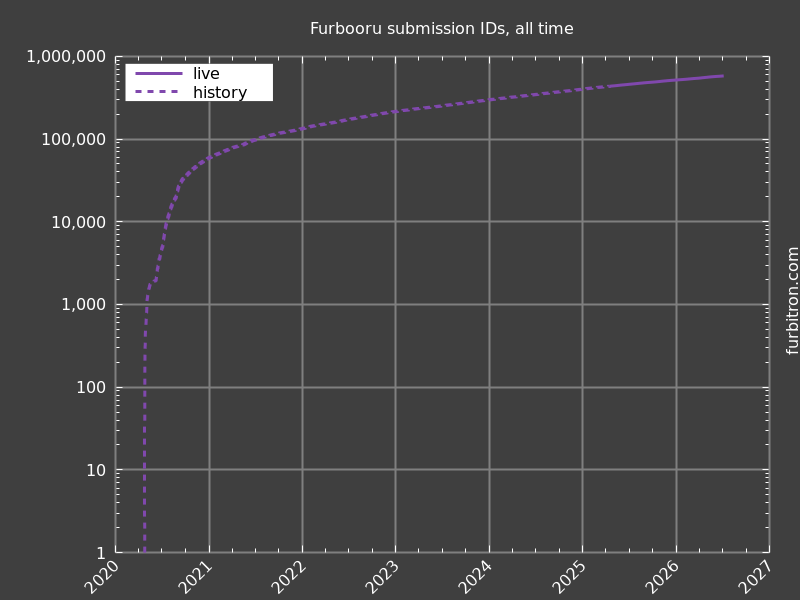
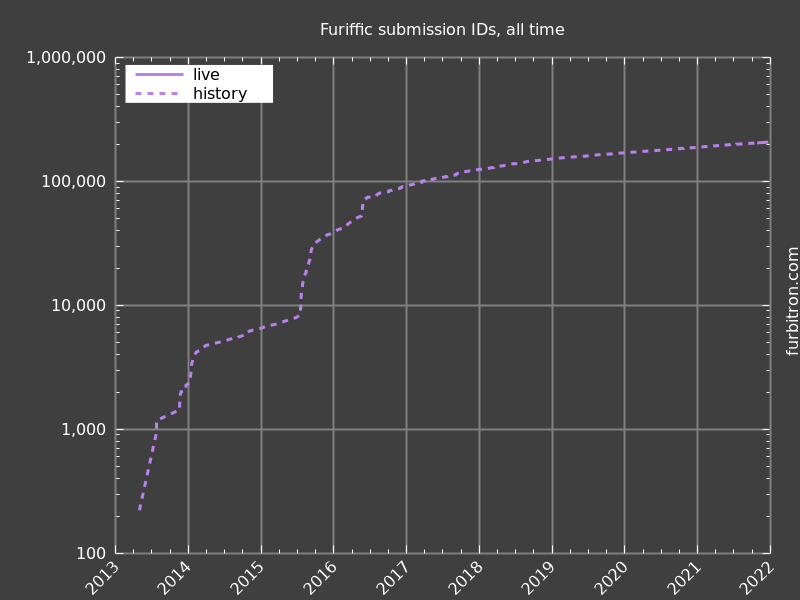
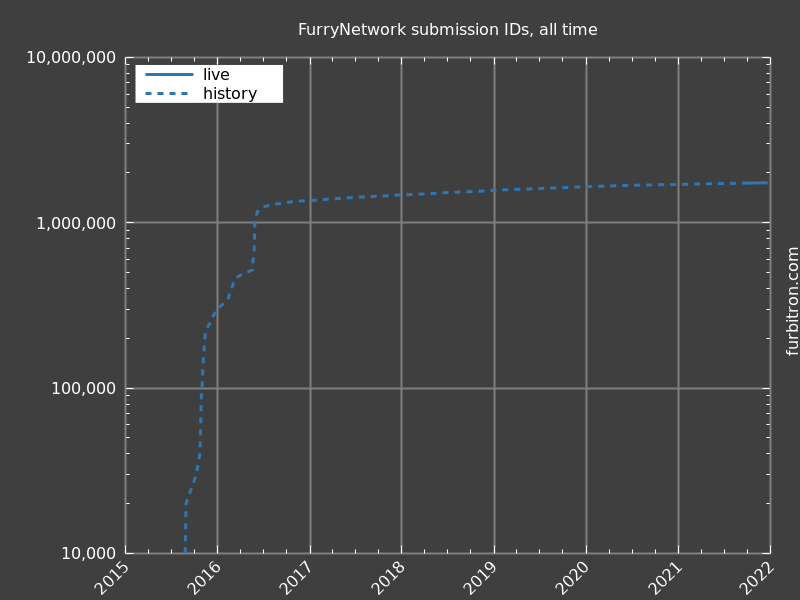
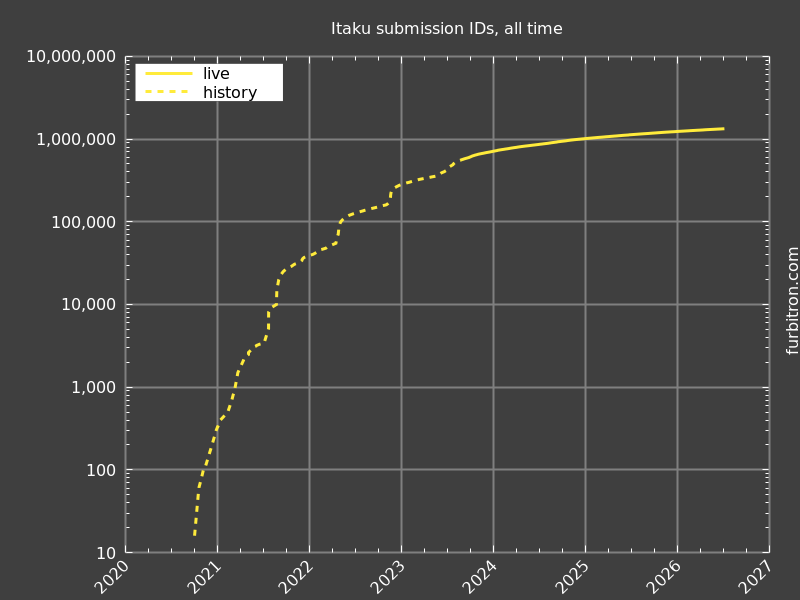
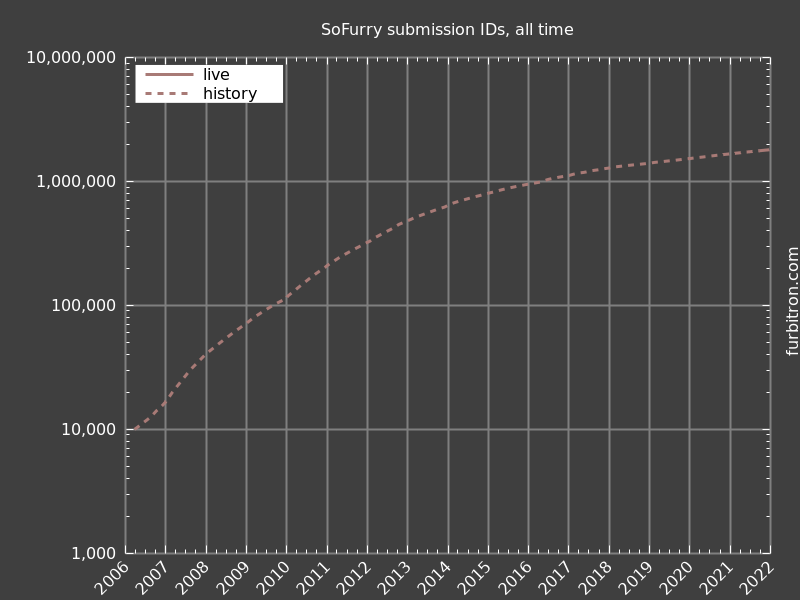
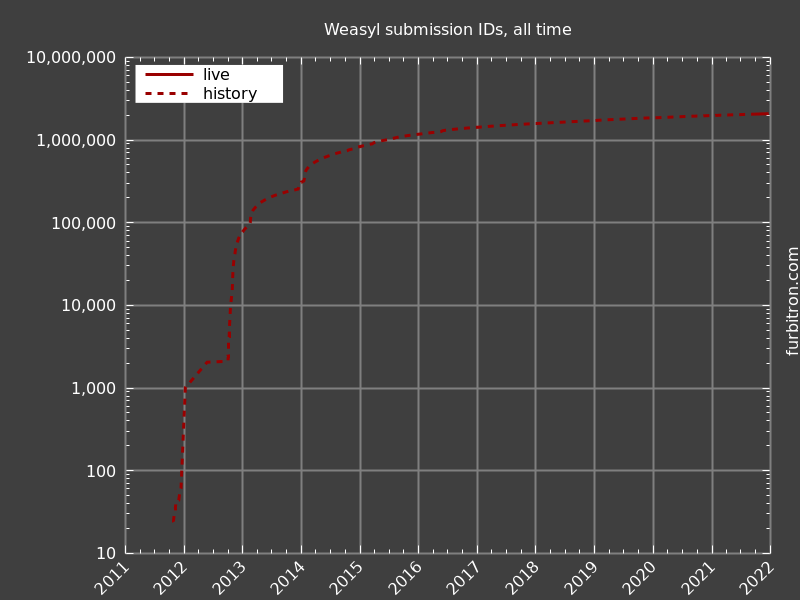
In December 2021, there was a question on the
e621 forums
about graphs with a log scale. These are not quite the same as what
the e621 poster asked about, but hopefully they are interesting.
They show the log of submission ID on the Y axis (vertical), vs
linear time on the X axis (horizontal). The first two graphs have
no legend, because the legend covered up too many of the data
traces. See the normal daily graphs for the legend.
The first version of this page was from December 2021. It has been updated with data through early July 2026.
Important: These graphs don't automatically update every day. They were generated one time, on 2026-07-06, with the data collected up to that time.